The most significant contribution of digital marketing is to help you track and measure your marketing initiatives for better ROI. Unfortunately, this data worth a gold mine has been under-utilized. Google provides a simple yet powerful way to capture user data on your website. All you need to do is embed a short Google Analytics code at the backend of your website. Here is a quick guide to help you decode and leverage some of the most useful metrics in Google Analytics.
- What is the Google Analytics code?
Google Analytics' tracking code (or ID) is a unique identifier that allows Google Analytics to collect data when inserted into a website. This data includes the time users spend on a webpage, search terms used, and how they came to the site.
- How do I embed the code?
Setup an account on analytics.google.com. You can simply follow the instructions provided by Google to create and embed the code on the website. You can also work with your web developer to embed the code at the backend of the website. It should not take more than a few minutes.
- How do I track the data?
Login to your account on analytics.google.com and select the account for which you want to view the metrics.
- How do I use the data to make ongoing improvements?
While Google Analytics does not provide individual data, it provides aggregated information about users visiting your website. This powerful and insightful data if tracked regularly and leveraged in the right way can help you significantly improve user engagement and use your website as an effective online sales tool.
Audience Metrics
For example, the Audience tab on your Google Analytics dashboard will tell you how many users come to your website, from what regions, and what devices they view your website on. Based on this, you can tailor the content of the website to your audience. You can also ensure your website is properly optimized for the devices most frequently used by your visitors.
Behavioral Metrics
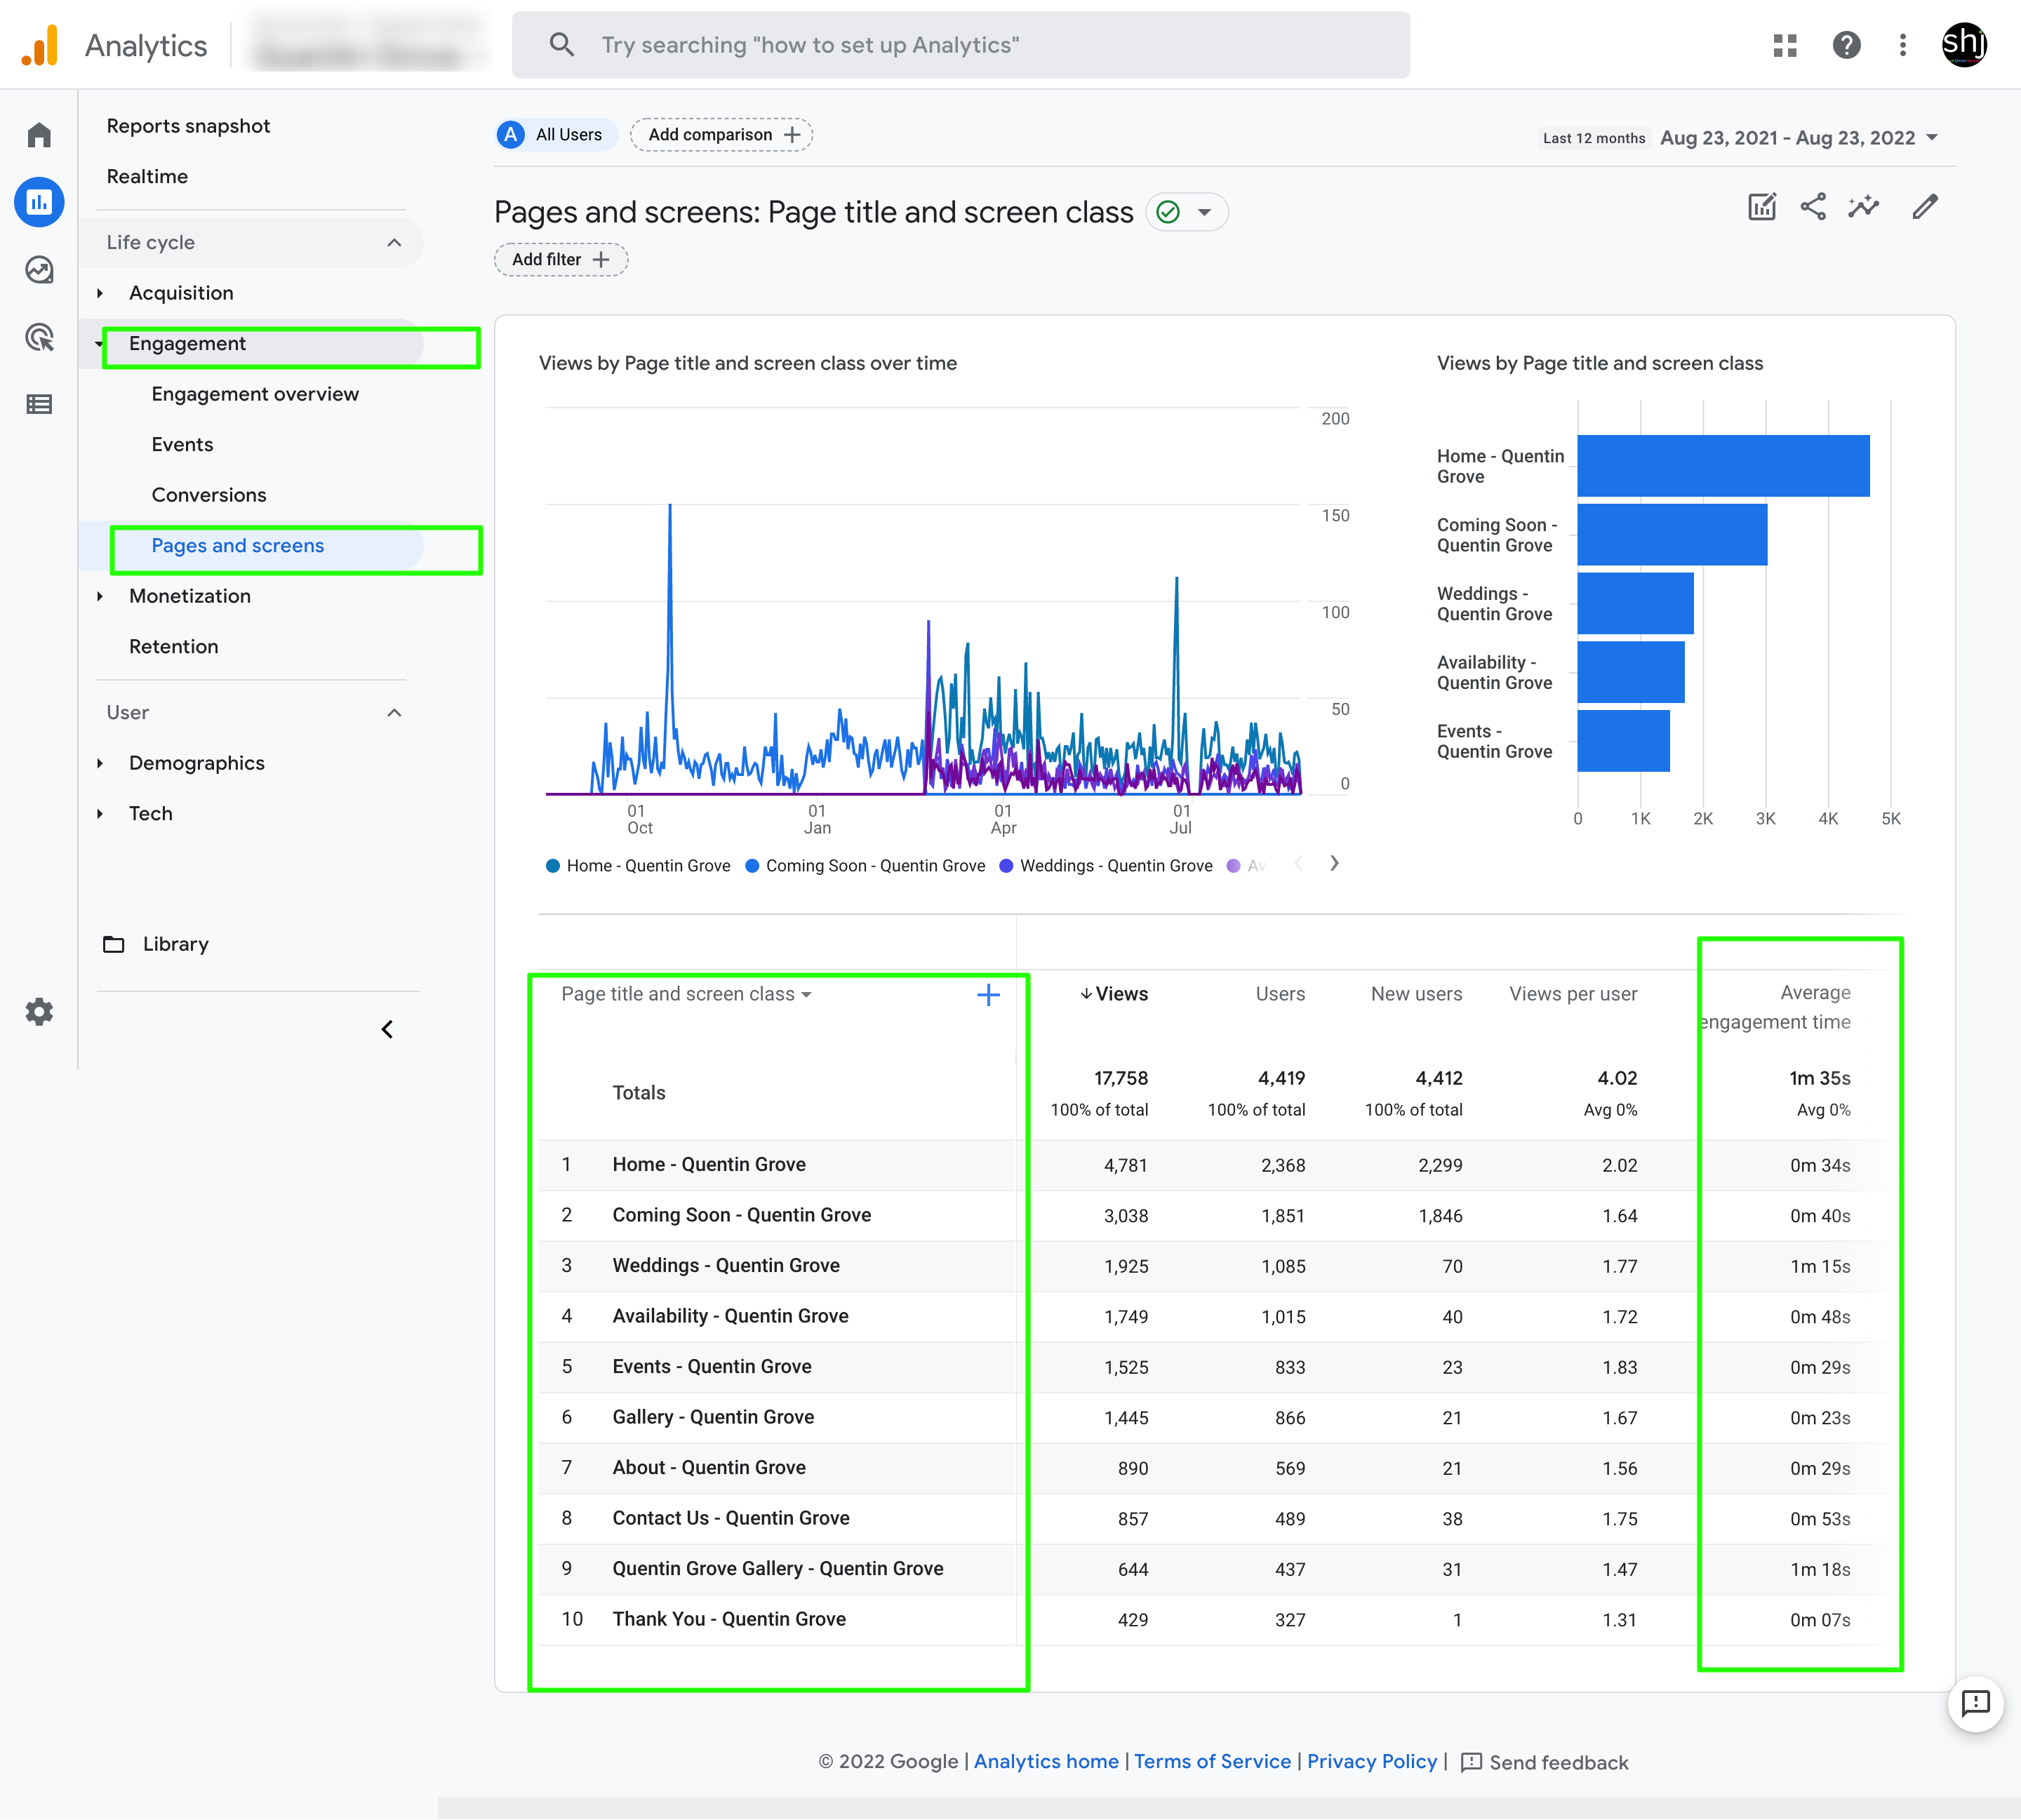
Another extremely powerful and insightful metric is Behavioral metrics. A quick visual scan can tell you which content or pages on the website users find most engaging. You can leverage this information while running your marketing campaigns, newsletters, and paid advertisements. We would also recommend creating more content on the website along these lines. At the same time, if users are not spending enough time on the important on featured pages on your website, you know it's time for a content refresh.
An interesting metric here is the “Average Engagement Time ”. In most cases, this metric is in the range of 0.5-3 minutes. With all the effort you spend on the website, that's all the time you have to make an impact on your prospective customers. A very low engagement time could be an indicator of a poor user experience and requires a quick diagnosis to evaluate the cause for this.
Acquisition Metrics
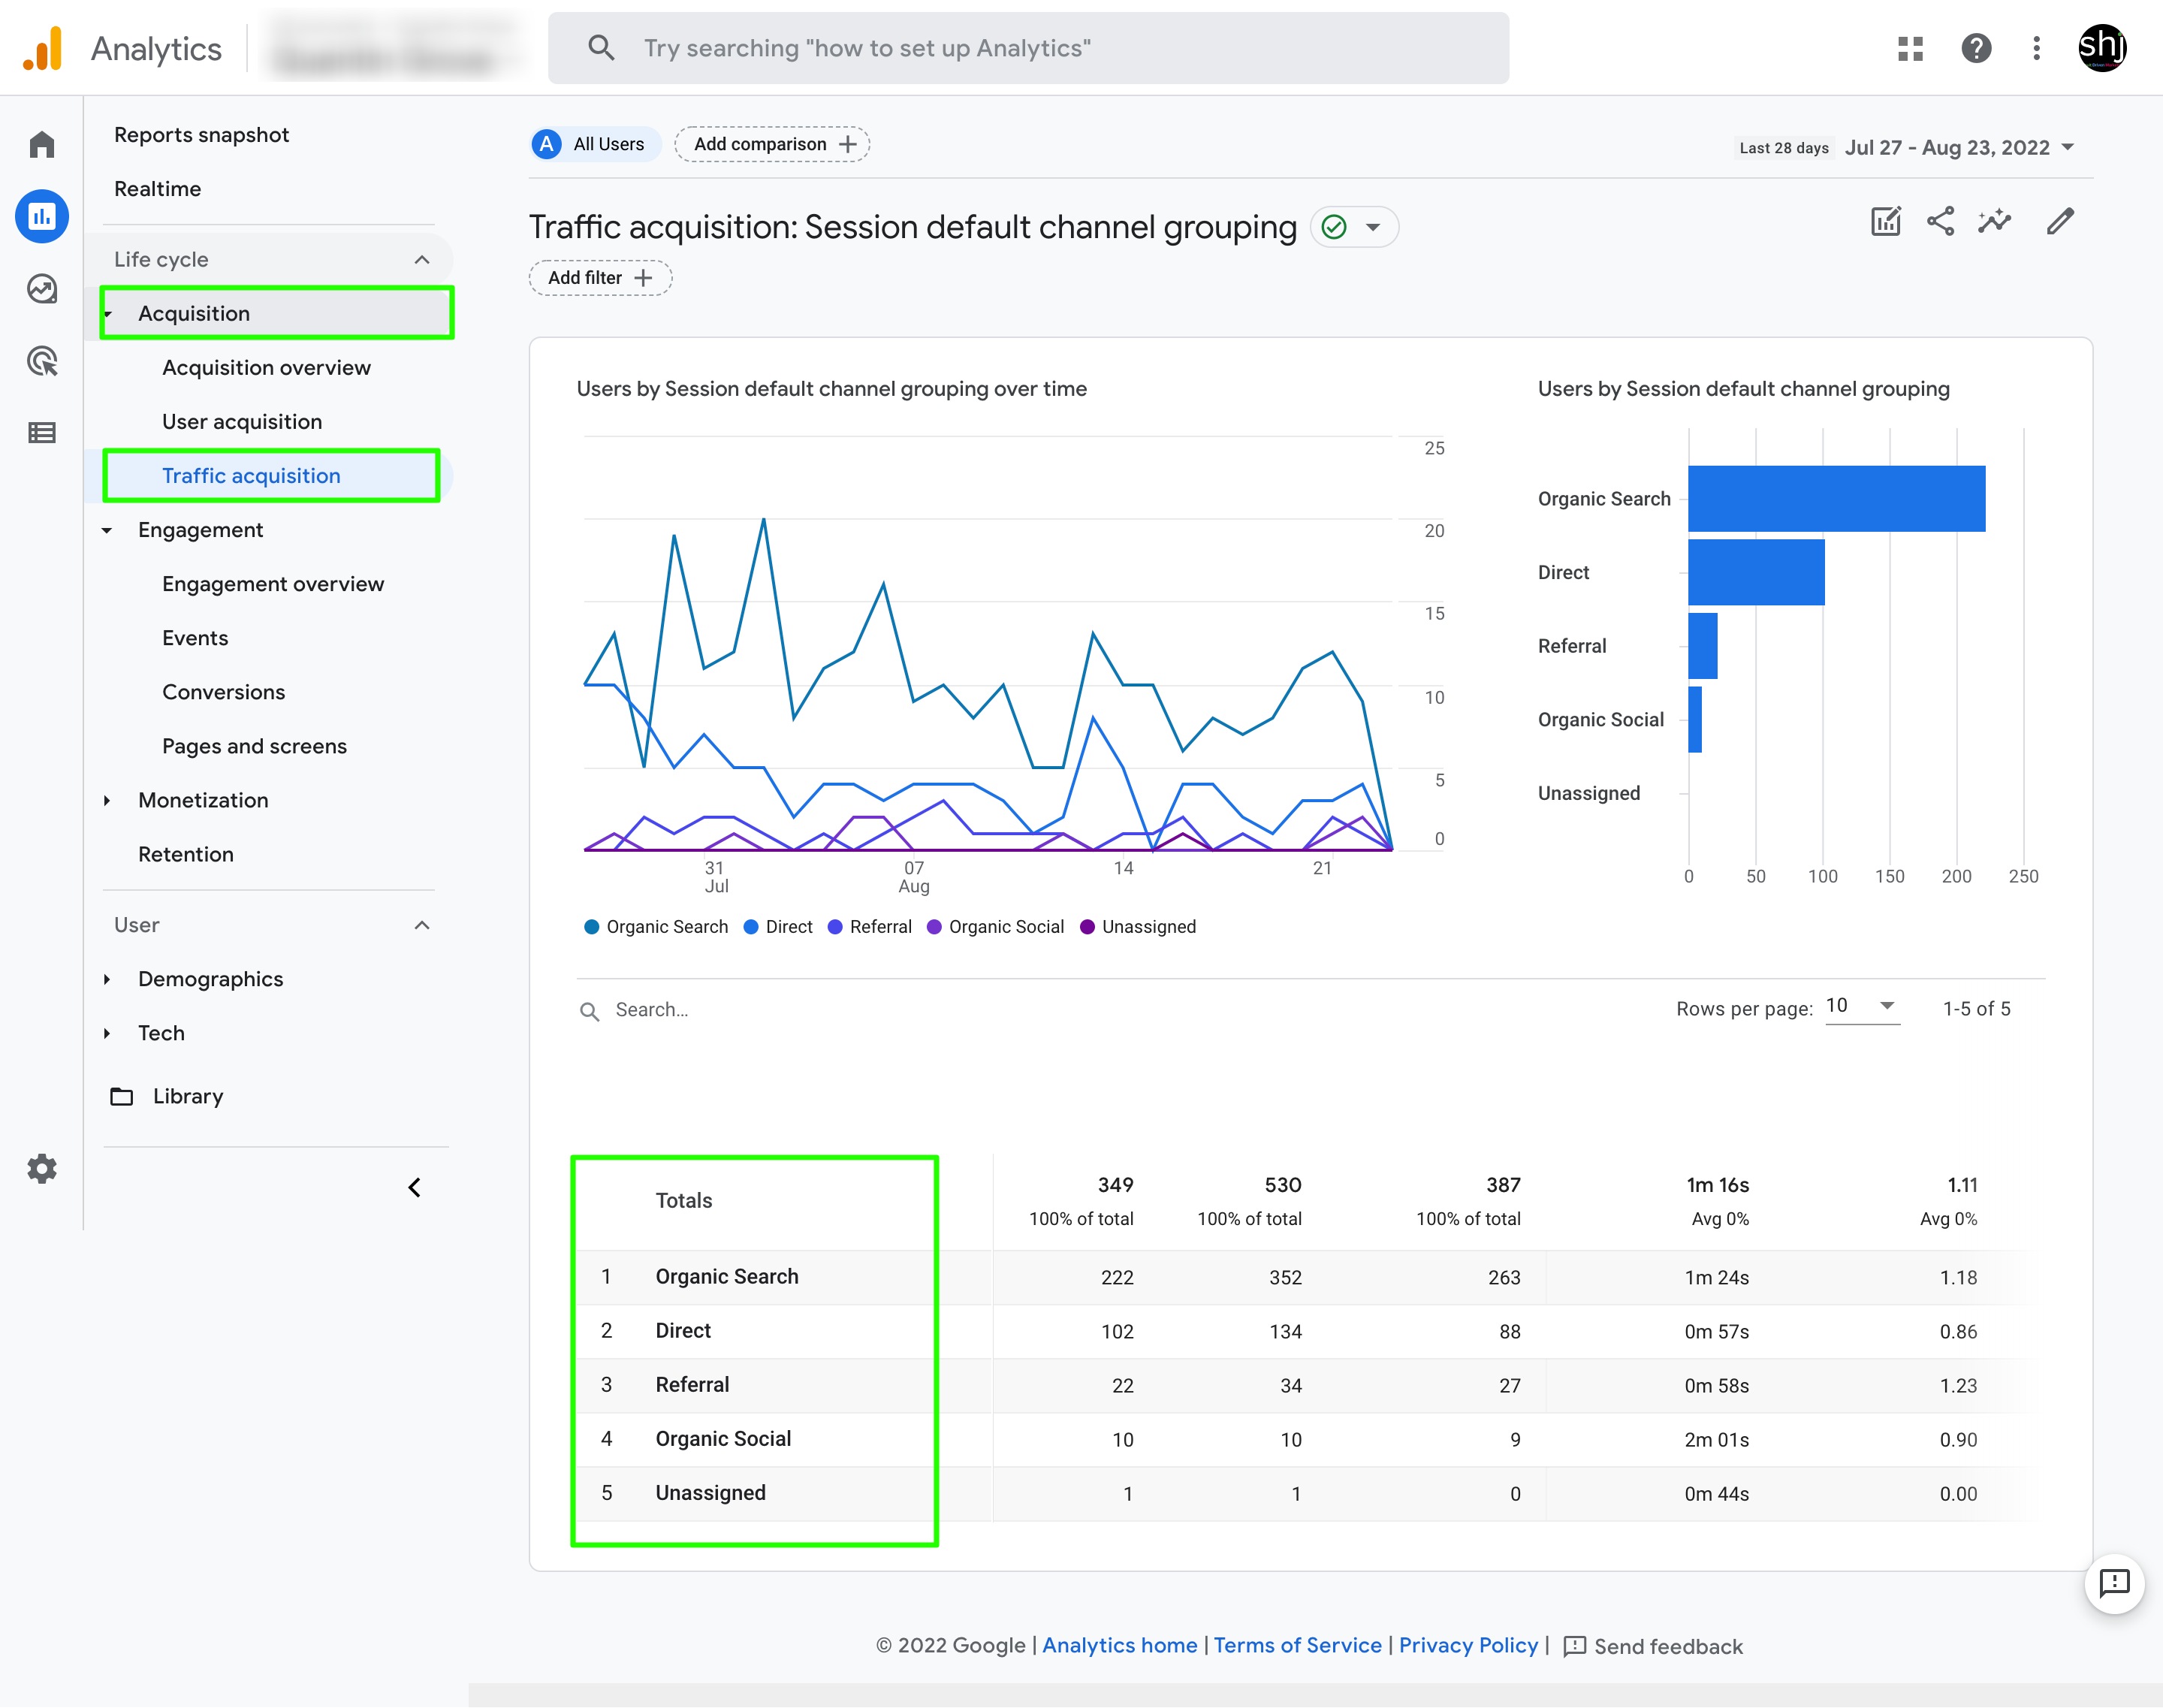
A quick visual scan of the acquisition metrics tells you the source of traffic on your website. This tells you where you should be focussing your marketing efforts. Organic search traffic in Google Analytics, it's referring to the traffic that's come to your site through unpaid search results on search engines such as Google, Yahoo, or Bing. Referral traffic is Google's method of reporting visits that came to your site from sources outside of its search engine. Direct traffic in Google Analytics is when someone types or pastes in your URL to visit your site directly, and clicks a bookmark. Traffic from your email marketing campaigns is often categorized as direct.
Ideally, you want to leverage all the possible sources to drive traffic to your website and this simple metric allows you to determine which channel is underutilized and you should focus your marketing efforts on.
This post is meant to be a quick self-help guide to start using Google Analytics and is not meant to serve as a training manual for Google Analytics which has much more in-depth features. We hope you find this helpful. We look forward to your feedback and suggestions


